Meta-analysis forest plots
Upload your extracted table or paste it into Multilo chat. It pools the studies, draws the diamond and adds the pooled results to your results section. Switch between fixed and random effects without rebuilding the figure.
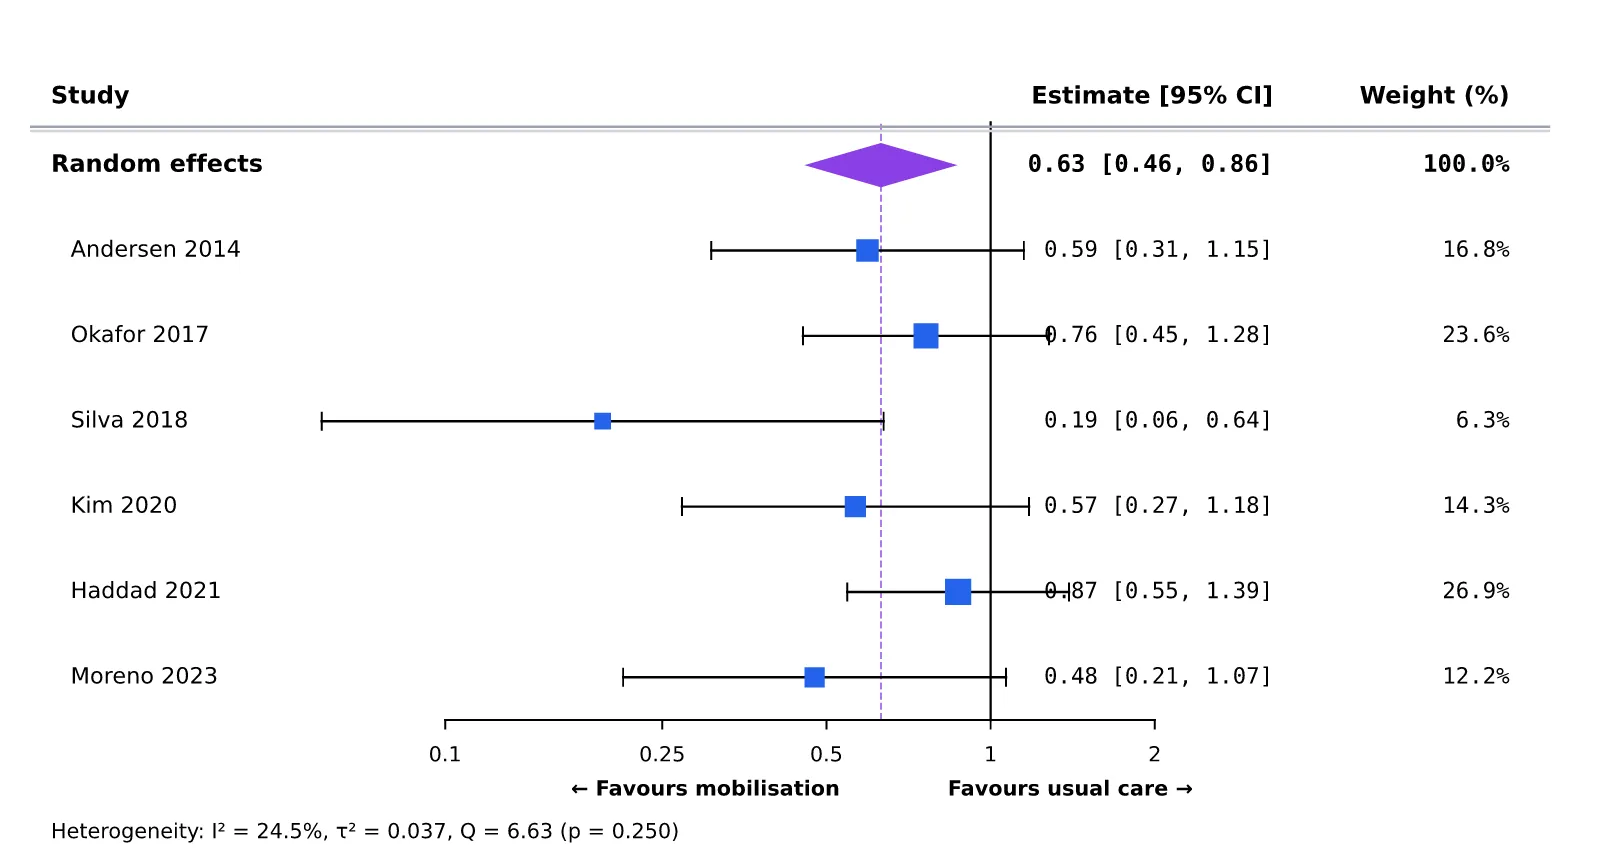
Get your study data compiled, and let Multilo handle the rest. It makes a pool of effect sizes, shows I², τ², p-values and the heterogeneity test, builds your forest plot, and adds it in your draft. No R scripts, no desktop license expenses, and no copy-pasting of graphs between software.
Forest Plot Creator
A forest plot is a standard figure in a meta-analysis. It shows the results of every study side by side, along with one pooled result.
Each square is one study’s effect, sized by its weight. The horizontal line through it is the 95% confidence interval.
The pooled estimate of all studies combined. Its width is the pooled confidence interval.
There is a line of no effect in the plot. 1 for odds ratios and risk ratios; 0 for mean differences. If the diamond doesn’t cross the line, the pooled result is statistically significant.
I² shows how much the study results disagree beyond chance. Roughly 25%, 50%, and 75% are considered low, moderate, and high respectively.
Multilo handles every step of the forest plot in your research workspace, from raw data to a graph that fits in your systematic review
Import event counts, means, and standard deviations, and Multilo will calculate odds ratios, relative risk, risk difference, or mean difference for your study automatically. Do you already have an effect size and confidence interval? Then import it Easily. The forest plot of your meta-analysis Shows every study, its Weight,And the pooled estimate.
I², τ², Cochran’s Q, and p-values are shown next to your graph, exactly according to your results section format. Without opening any other tool, see how consistent your studies are with each other.
Prepared Forest Plot directly moves to your draft as a high-resolution figure.
Choose fixed effects or random effects and see an updated graph immediately. Divide studies into subgroups, and Multilo prepares separate whole estimates and complete results.
Tell Multilo that you need a forest plot, or allow it to choose an appropriate chart based on your data. In order to start work, only simple words are enough.
Multilo can write a paragraph of descriptive statistics and results alongside your plot, so that your results section starts with already written text rather than an empty page.
Build the Prisma flow diagram for your systematic review in your workspace so that the process of choosing studies and your results are presented in the same draft.
Multilo builds the forest plots exactly how your journal demands and handles all types, from pooled meta-analysis results to regression models.
Upload your extracted table or paste it into Multilo chat. It pools the studies, draws the diamond and adds the pooled results to your results section. Switch between fixed and random effects without rebuilding the figure.
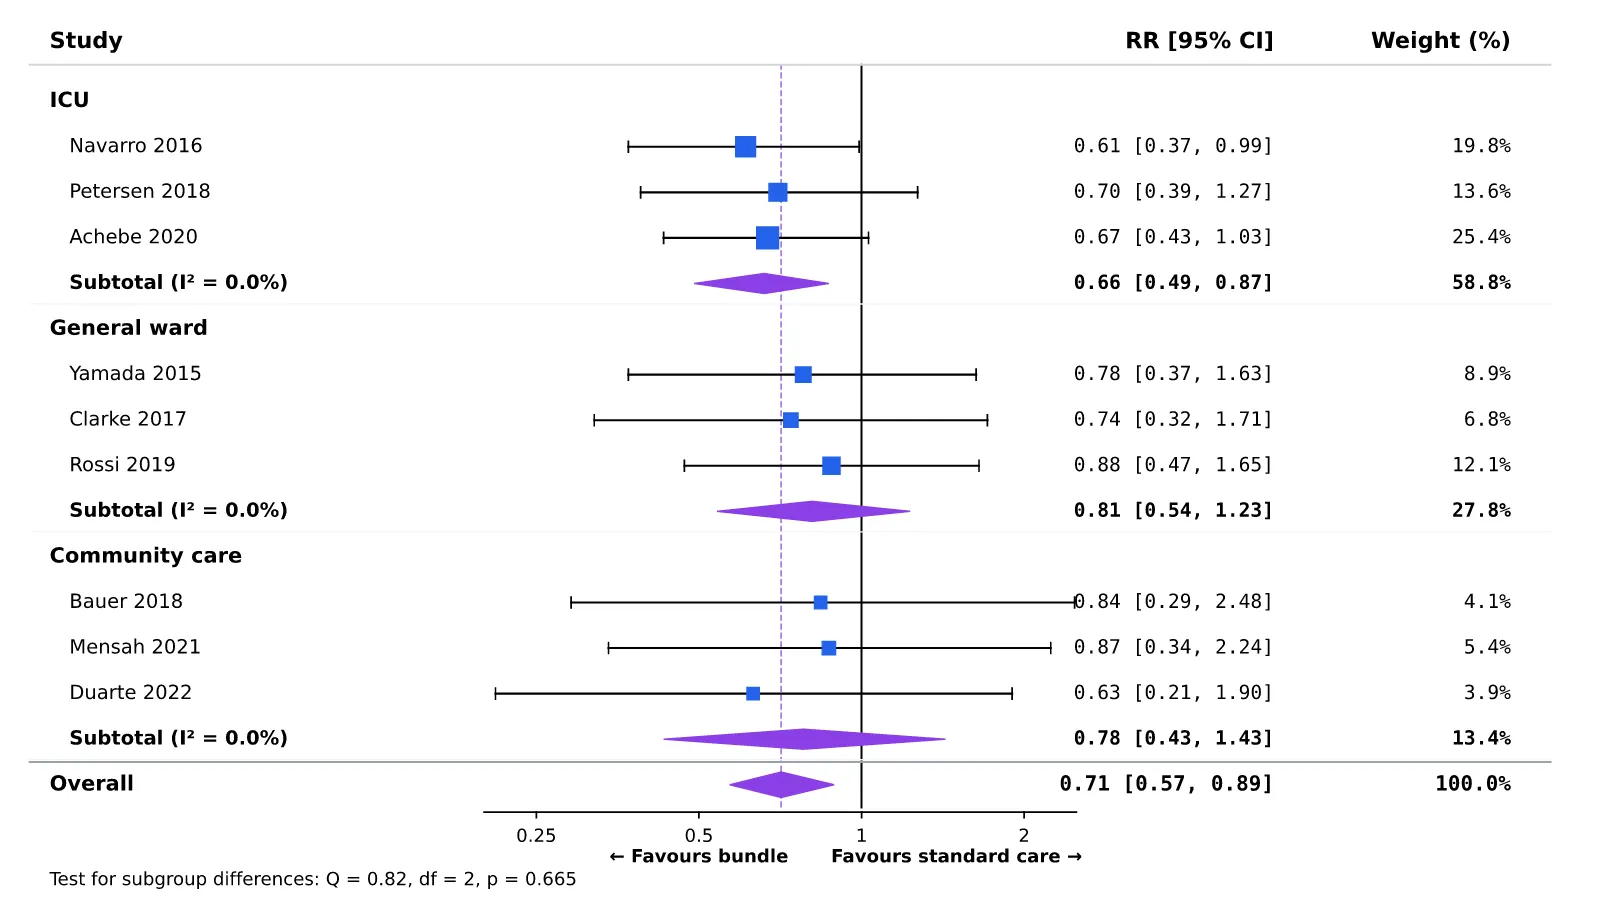
Add a subgroup column to your spreadsheet, and Multilo gives each subgroup its own row. Generate subtotal diamond and heterogeneity statistics from your provided data, ready to describe in your draft.
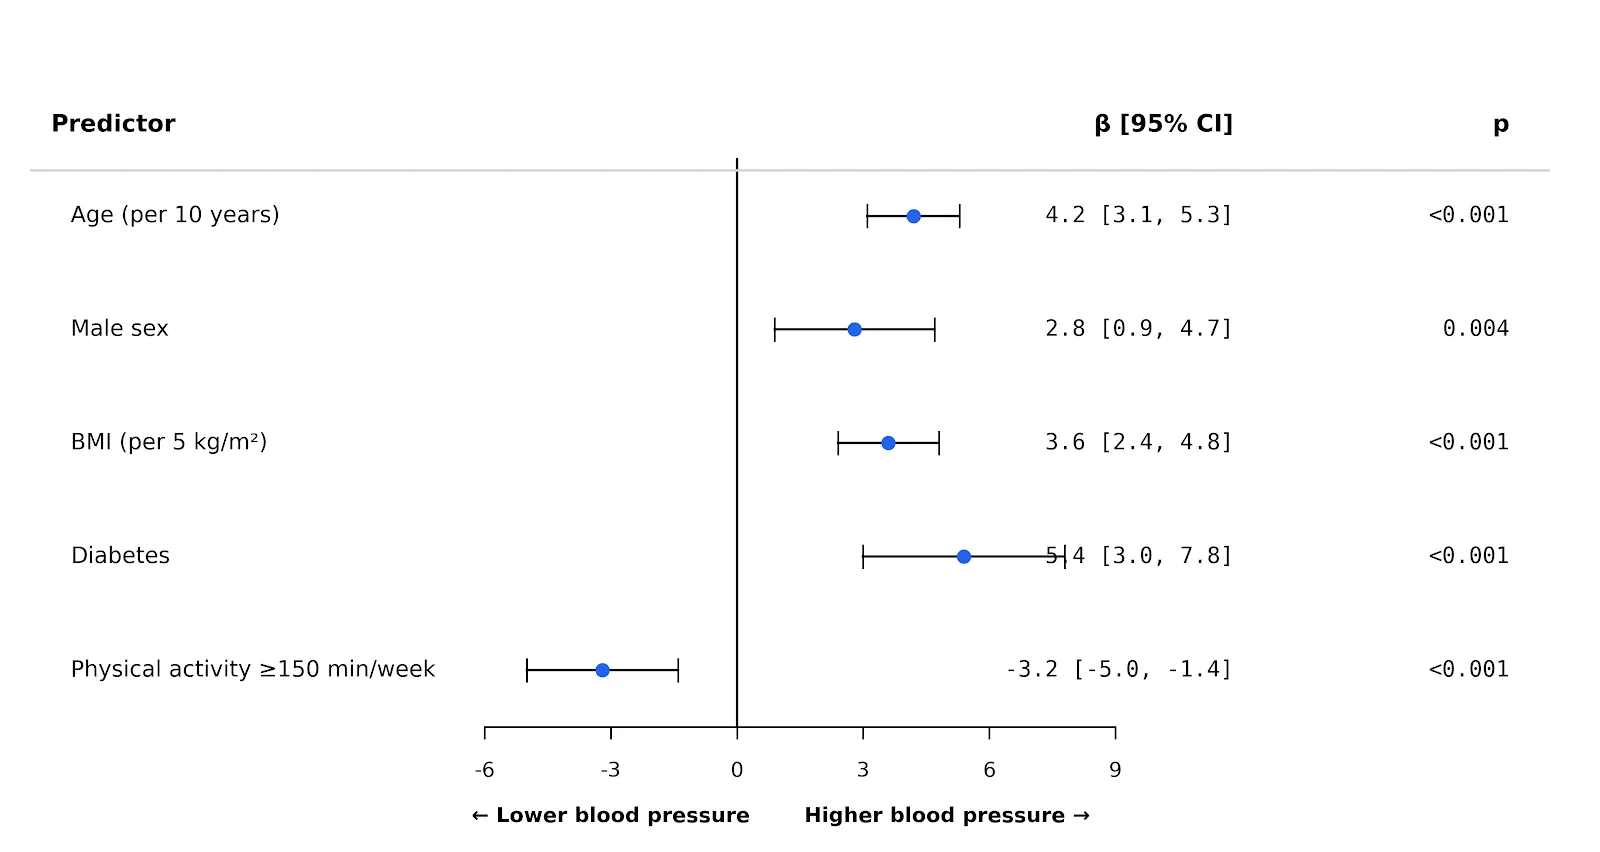
Have you already run your model in Spss, Stata, or R? You can paste the coefficients and confidence intervals into the Multilo and get the plot done from your results section without further coding.
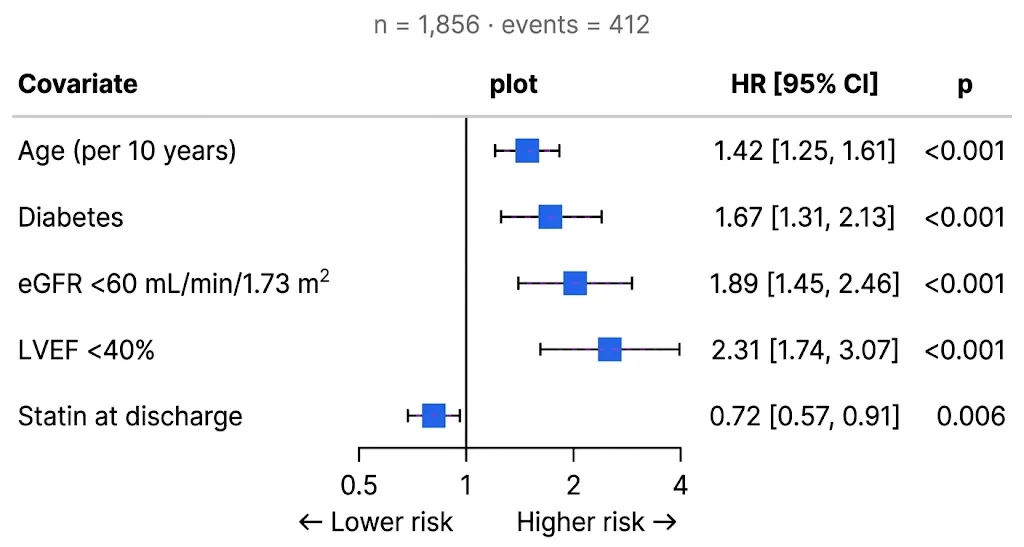
Turn your survival and cox model results into a log-scale hazard ratio plot with a clear reference line that matches the style of every other figure or plot in your thesis or research paper.
Multilo calculates the odds and risk ratios directly from the event marked in your file and set the log axis and reference line for you in the plot. No need for time-consuming manual formatting before submission.
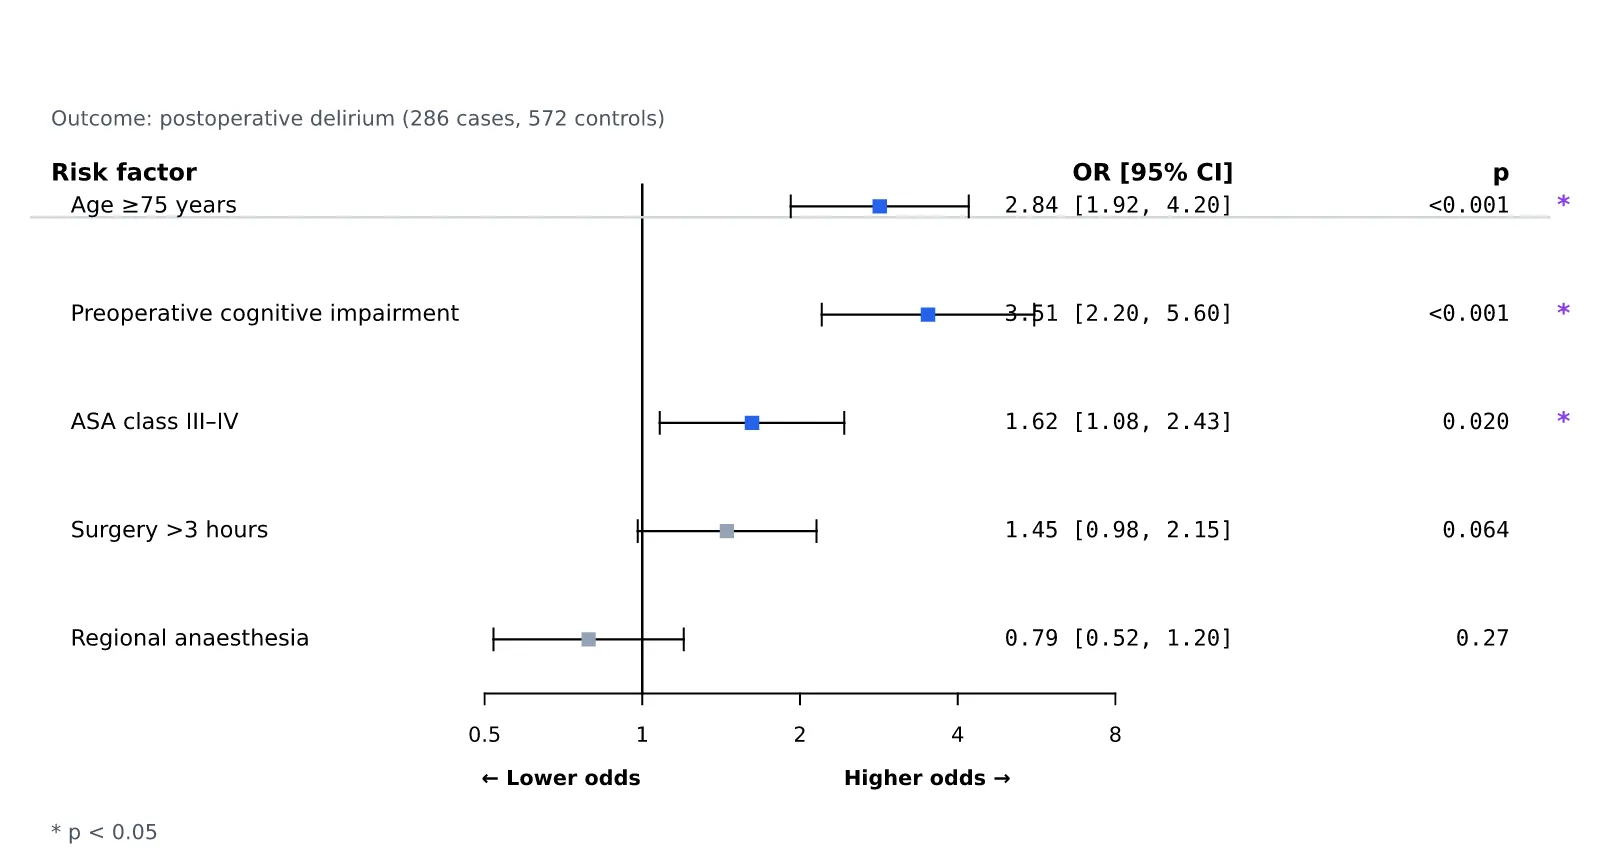
You can choose your own reference line, effect measure, rename columns, reorder studies or highlight the key rows to meet your journals’’ requirements. All your settings stay with the figure, so you can update it in seconds later.
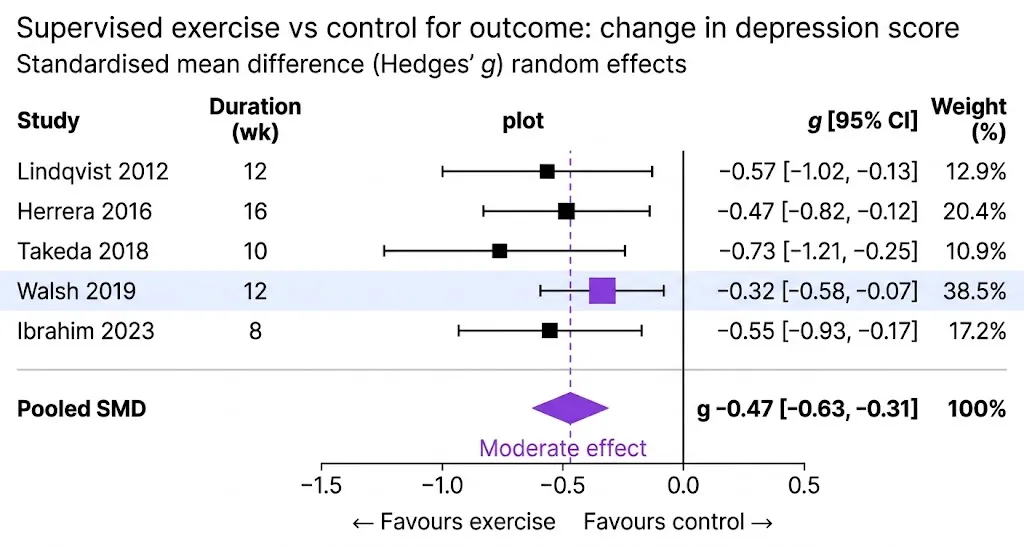
You can make a forest plot in different tools, but the actual difference is how many settings, tools, and how much hard work you have to do to get it done
| Feature | Multilo | RevMan | CMA (Comprehensive Meta-Analysis) | R (Meta packages) | AI Chatbot |
|---|---|---|---|---|---|
| Setup time | Take minutes ✅ | Have to set up review | Install license | Install R packages and script | No settings, but analyze yourself |
| Learning difficulty | Very easy ✅ | Moderate | Moderate | Difficult, coding is compulsory | Easy, but need to verify results |
| Ease of use | Import data, choose a model, and insert | Based on structured form | Based on menu | Based on code | Conversational, but no specific analysis tool |
| Heterogeneity (I², τ², Q) | yes ✅ | yes ✅ | yes ✅ | With code | Not reliable |
| Direct insertion in docx. | yes ✅ | ❌ | ❌ | ❌ | ❌ |
| Cost | Check pricing | Free for many educational users | Paid license | Free | Free or subscription |
| Works offline | yes✅ | Web-based | yes | yes | ❌ |
Make every graph, write your review, and add citations in the same Multilo project. Rework any sentence, and your sources stay linked, all locally on your desktop.
Combine the results of multicenter trials in one plot and show the pooled effect of any intervention.
Combine the diagnostic study accuracy and sensitivity in the same place.
For your public health review, combine the studies of risk factors and environmental effects.
Give every meta-analysis in your dissertation the same look, chapter by chapter.
Everything you need to know about writing with Multilo
A forest plot is the main figure of a meta-analysis. It shows each study’s effect size and confidence interval on one row, with a diamond at the bottom for the pooled result.
You can interpret it in four steps.
First is the direction. Check which side of the line of no effect the diamond falls. It can be done using a “favors” label under the axis.
Secondly, check the significance. If the diamond doesn’t cross the line of no effect, the pooled result is statistically significant.
Third, you should check the precision. If the graph shows a narrow diamond and study lines, it means it has a precise estimate; however, wide ones mean more uncertainty.
Then, check consistency. If the study lines overlap and I² is low, then it means the studies agree, but if they point in different directions and I² is high, then you should look for a reason; for example, analyze subgroups.
Multilo shows I², τ², and the Q test beside your plot, so all four checks are on one screen.
Yes, import your file, choose your model and effect measure, and Multilo will prepare it in your draft. For this, no need for workarounds in Excel.
Random effects is better for those studies whose population or methodology is different, while fixed method assume same effect of all studies. You can switch between them, and to verify your selection, you can see the I² and τ² values.
The studies in which compulsory values are missing, Multilo flag it so than you can complete it or remove it. After this, recalculate the pooled estimate from the remaining studies. State your exclusion criteria in the methods section.
Yes, you can make changes to labels, color, and layout and match the figure to your document style.
Yes, point Mutilo to any data set in your research project or import a new file, and then choose your model.
No, Multilo handles all research datasets easily. However, a large dataset may take longer.
Download Multilo, write your systematic review, and change your study data from a spreadsheet to a forest plot