Enter your data
- Paste numbers or upload a CSV file, and for group comparisons, you can use a table or label each group or let multilo handle it.
Paste your numbers or upload a CSV or Excel file and get a smooth distribution curve in seconds with accurate values. Choose the kernel and bandwidth, compare groups, and generate a publication-ready kernel density plot for your paper.
A density plot is a smoothed version of a histogram. It estimates the probability density function of one continuous variable using a sample.
The bandwidth has a greater effect on the curve than the kernel choice. Start with Silverman’s rule, then try 0.5× and 2× the bandwidth to see which patterns remain consistent.
The y-axis represents density, not probability, and the total area under each curve is 1.
If you want to compare two to five groups, placing their curves on the same plot makes the differences easier to see. With more groups, a ridgeline plot is a better choice.
When working with data that has fixed limits, such as time or concentration, use boundary reflection to keep the curve from extending beyond the allowed limits.
Most online density plot tools only let you create a graph. Multilo goes a step further by helping you understand the results, check your analysis, and prepare text for your research paper. You can also keep your figures and related research together in your Multilo workspace
You can choose from six kernels, which include Gaussian, Epanechnikov, biweight, triangular, cosine, and uniform. You can also use Silverman’s rule, Scott’s rule, or manually enter your own bandwidth.
Compare 0.5× and 2× bandwidth curves with one click. This helps you check whether a peak is a consistent pattern or the result of your bandwidth choice.
Use reflection at zero or another specified limit to keep the density curve within the valid range. This is especially useful with durations, counts, and concentrations that cannot fall below zero.
Overlay up to 8 groups on the same plot to compare their distributions. Plus, for two groups, you also get the overlap coefficient and median difference.
Export your density plot as a 2× PNG or vector SVG.
Get ready-to-use methods and results sentences and an APA 7 caption. Each one uses your actual measurements like bandwidth (h), sample size (n), mean, standard deviation, and peak values.
Everything is explained the way you write it, including its shape, skewness, and peaks. Multilo also points out when the mean and median tell different stories, which helps you describe the results more accurately.
Random bumps look like extra modes
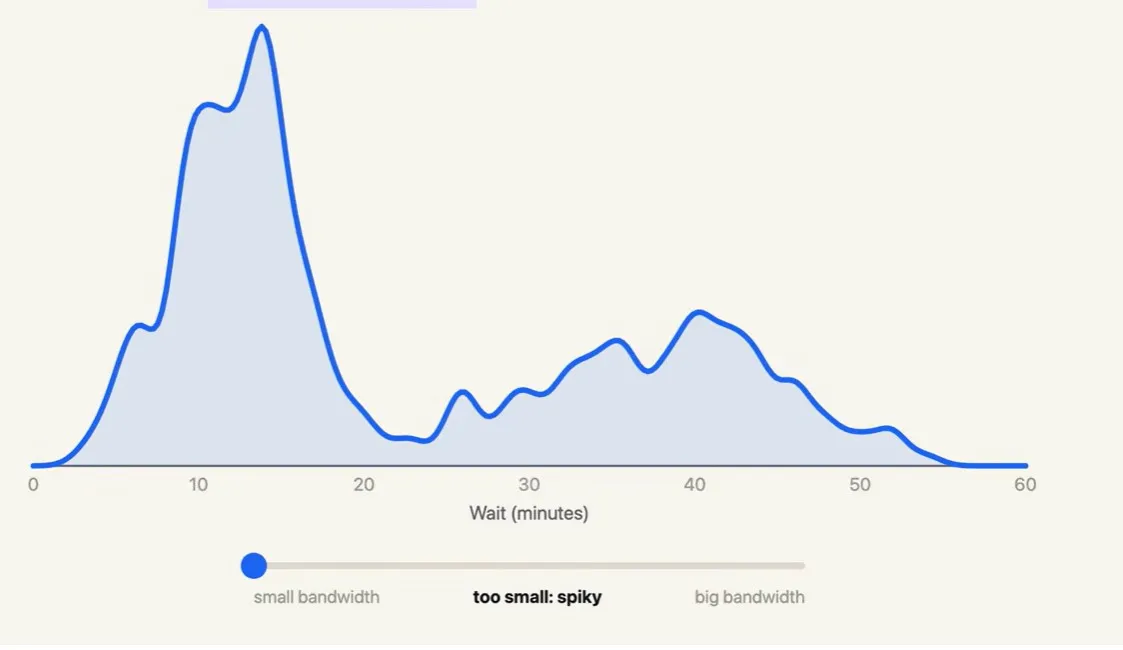
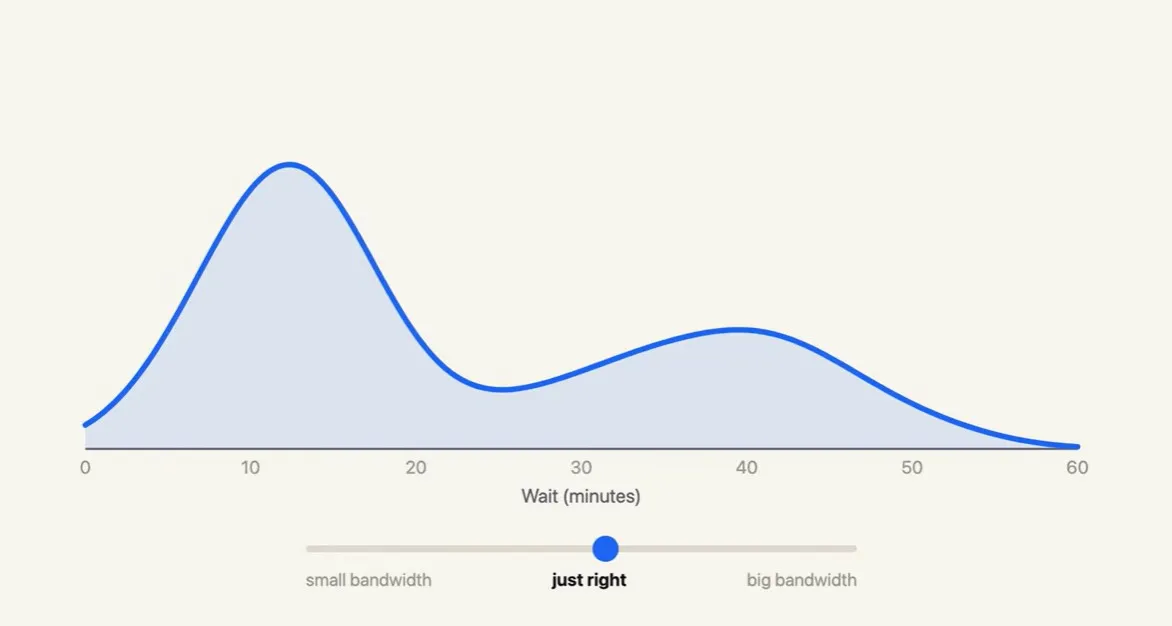
two clear eruption types, short and long
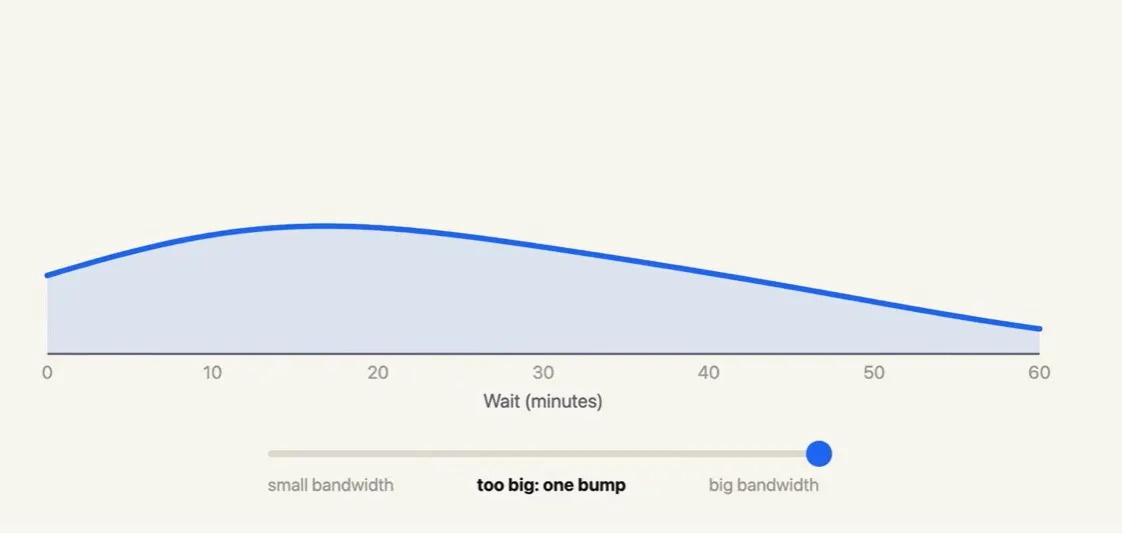
The two peaks almost merge into one hump, hiding a real bimodal pattern
Create a properly labeled figure and get a ready-to-use description without having to learn R first.
Example: Comparing score distributions across dissertation cohorts
Check distribution shapes before selecting a statistical test and report bandwidth in a format reviewers expect.
Example: Checking reaction-time skew before fitting a mixed model
Work with bounded measurements such as concentrations, durations, and length of stay using boundary correction.
Example: Comparing biomarker levels between patients and controls
Compare groups by looking at their distribution shapes rather than averages alone. Export clear figures for reports and presentations.
Example: Comparing order values across regions or campaigns
The variable is continuous: times, scores, concentrations, prices.
You want to compare the shape of 2–5 groups on one axis.
You need to check skewness or bimodality before choosing a test.
You have at least about 30 observations per group.
You want a figure without the visual noise of bins.
The data are categorical or have few distinct values (Likert items, counts 0–5): use a bar chart.
You have fewer than about 15 values: show the points with a dot or strip plot.
Readers need exact frequencies: use a histogram or table.
You’re comparing many groups at once: use a ridgeline or box plot.
You need two variables together: use a 2D density or scatter plot.
Draft, cite, research, and refine without ever leaving your project — and it all keeps working offline, on your device. Free to start, no account needed.
What sets Multilo apart
Paste straight from Excel, Google Sheets, Spss output, or a CSV. Multilo detects one list, named groups, wide tables, or long group-value tables automatically.
No code needed
Sensible defaults: Silverman bandwidth, Gaussian kernel, rug and mean lines
Live update as you edit values.
A density curve depends heavily on the bandwidth you choose. Multilo lets you compare different levels of smoothing, warns you about small samples, and corrects boundary bias so your curve better reflects the data.
Compare curves at 0.5× and 2× bandwidth.
Get warnings for small samples (n < 30).
Use reflection to handle bounded variables.
Copy ready-to-use methods and results sentences, along with an APA 7 figure caption. Each includes your kernel, bandwidth, sample sizes, peaks, and summary statistics, so the text matches your figure.
Ready-to-copy methods, results, and captions.
Overlap coefficient for comparing two groups.
Automatically updates when you change settings.
Multilo works as the integrated workspace for research. You can save the plot, understand it, and, when it is ready, add it directly to your project dataset. This way, your analysis notes, draft, and figures stay in the same place, so you can trace everything back easily.
Figure, settings, and data saved together
Reopen and change bandwidth months later
Insert the figure and caption straight into your draft.
Start by looking at where most values fall and how widely they are spread. A long tail on either side shows skewness, while two or more peaks may indicate different groups within the data. The y-axis shows density, so focus on the area under the curve rather than the height alone.
You should use a density plot if you want to compare shapes across groups or spot skew and extra peaks, because it has no bins whose position can change the picture. And use a histogram when readers need exact counts or your data are discrete. If you can’t decide, show both: Multilo can draw a histogram layer under the curve.
Absolutely not. Multilo starts with sensible defaults (Gaussian kernel, Silverman bandwidth), explains what your curve shows in plain language, and writes the methods sentence for you.
Yes. You can export the high-resolution figures that follow the same standards you need and use them directly for your journal submissions. define the kernel type, bandwidth, or sample size, or let multilo choose the appropriate figure type according to your data, and get the publication-ready KDE plot in minutes.
Alongside density plots, Multilo makes histograms, box and violin plots, bar graphs with error bars, scatter plots, line graphs, heatmaps, forest plots, Bland-Altman plots, standard curves, and Consort and Prisma flow diagrams, all in the same style and all placed straight into your draft.
Download the desktop app and open your first project — free to start