Bar Graphs with error Bars maker

Build Bar Graphs With Error Bars in Seconds, Straight From Your Replicates

Multilo turns your raw replicate data into a publication-ready bar graph. It calculates the standard deviation (SD), standard error mean (SEM), or 95% confidence interval for you, and inserts the finished graph into your draft.

Watch how it works

Bar graph with error bars generator

Key takeaways

  • Each bar represents a group’s mean, while the error bar shows variation across replicates, or the precision of the mean.

  • The type of error bar changes the story; SD shows the spread of data, while SEM and 95% CI show how accurately the mean is calculated.

  • Always name the metric and n, as readers can’t interpret an error bar unless the caption defines the metric and number of replicates in each group.

  • For small samples, show each data point as a dot to show how individual measurements are spread around the average. 

  • Multilo automatically calculates the SD, SEM, or 95% CI so that every bar correctly matches your actual data, and the formatting style is kept the same as the document for consistency.

From Raw Replicates to Final Figure

Multilo’s agents handle your whole research workflow — draft, cite, research, and refine without leaving your project window

Automatic Calculation of Error Spread

Attach your raw replicate columns, and Multilo automatically extracts the mean and error for every group. Select SD, SEM, or 95% CI, and you get the updated bars. Now, you don’t need to use the Stdev formula or set custom error bars in Excel.

Grouped bars, styled for your journal

Keep multiple series side-by-side, set custom error bar caps, and adjust axis titles, scales, and colors so that it matches exactly what your journal demands.

Show every replicate

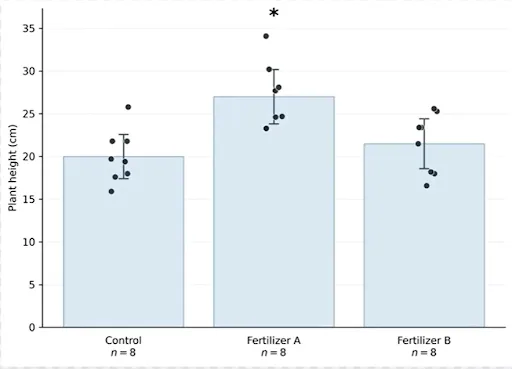
Keep overlaying every replicate as a dot above the bar, so that the reader can see the actual spread present behind the average and your figure is completely transparent.

Straight into your .docx file

Multilo fits the high-resolution figure in your document style into the draft. No need for any screenshots or folder exports.

Describe it in plain words

Tell in simple words what you want, or allow Multilo to select according to your data automatically.

Why Multilo

Get Caption and Result Texts in your draft

Multilo automatically writes the figure caption, descriptive statistics, and complete result paragraph with graph, so that your results section starts with written text rather than looking like a blank page.

Same Data, Three Different Error Bars

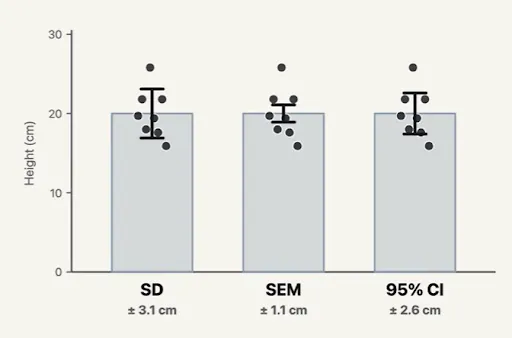
Choose the error bar carefully, as it changes your whole figure analysis. Below, there are two groups defined in three different ways. In Multilo, you can switch between them in one click, and all your data, captions, and results updated accordingly.

Mean ± sd: standard deviation

SD: shows how spread out your data is

SD describes the variation between your replicates, and it doesn’t shrink as you add more samples.

  • Use this type of graph when you want to show variability in your samples.
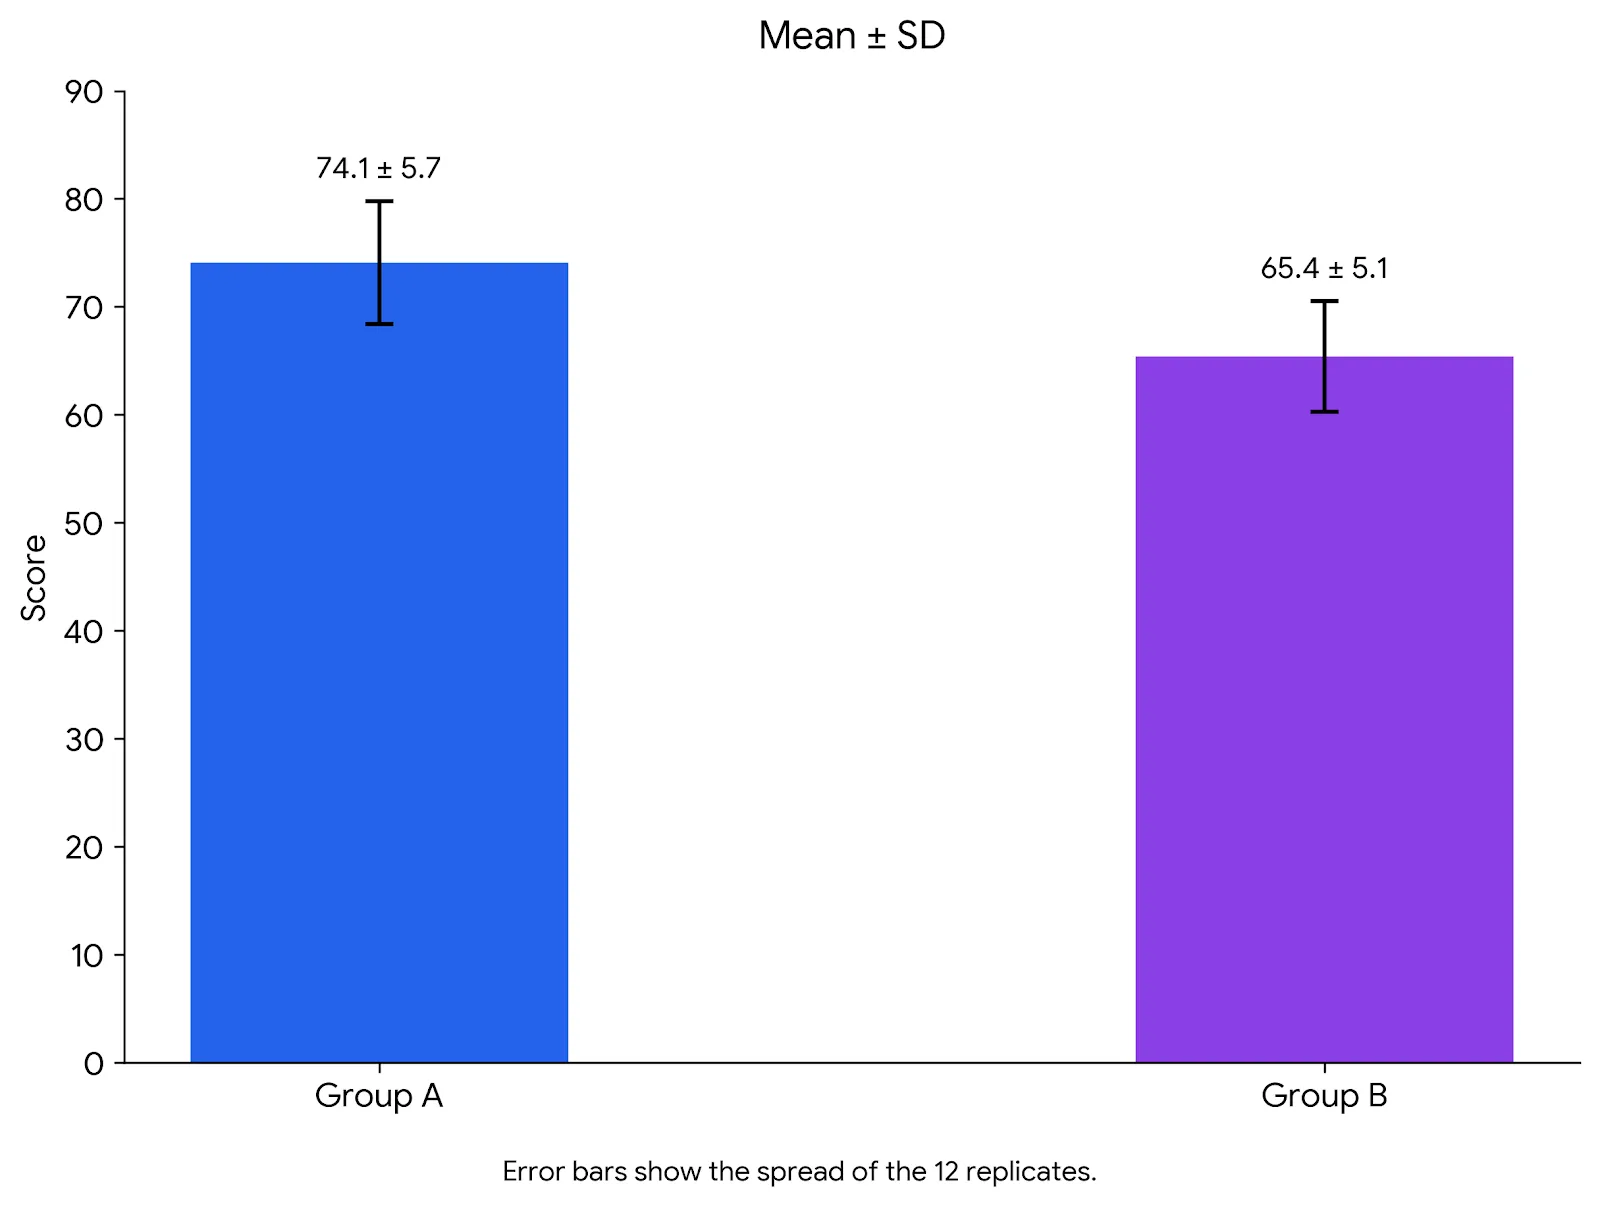
Bar chart of Group A and Group B scores with mean ± SD error bars, showing the spread of 12 replicates
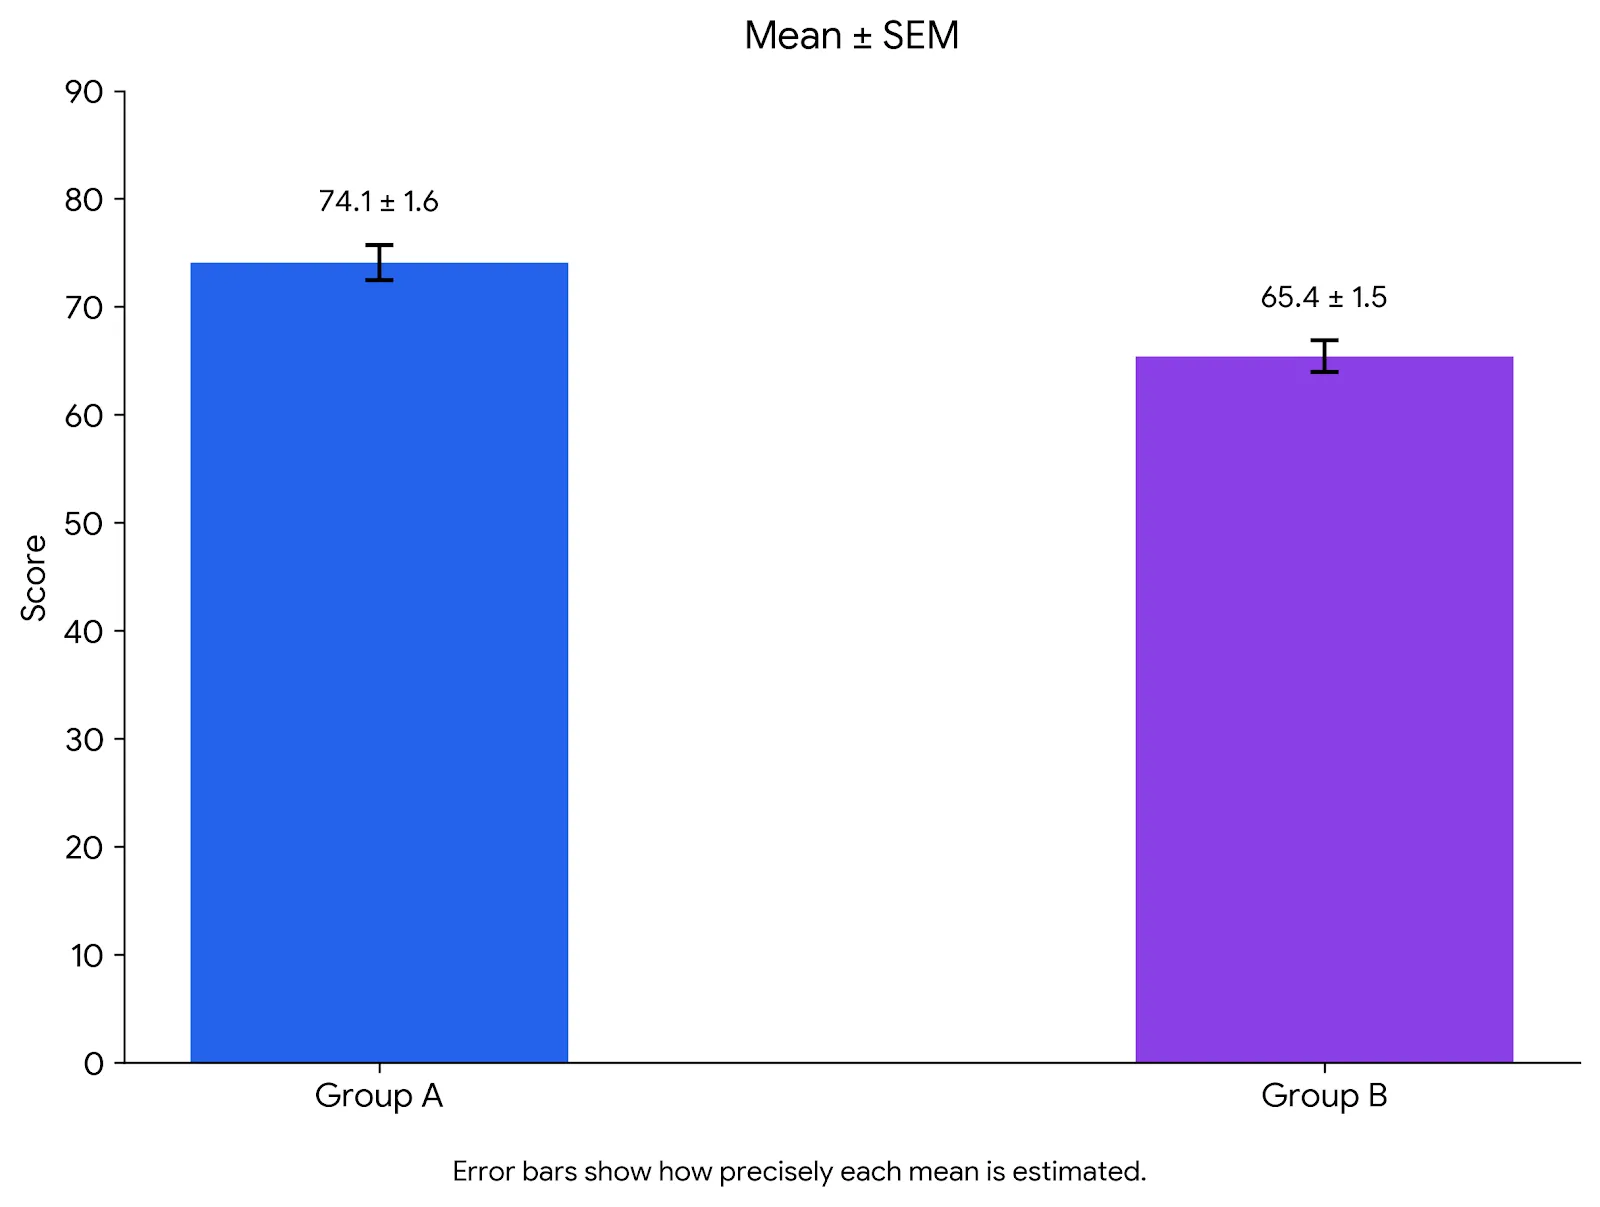
Mean ± SEM: standard error

SEM: shows how precise your mean is

SEM is SD ÷ √n, so the graph gets smaller when you add more replicates. Short bars can look convincing, so use it for the right reason, not for looks.

  • It is best when you are comparing group means and your field demands SEM.

Bar chart of the same two groups with shorter mean ± SEM error bars, showing how precise each mean is
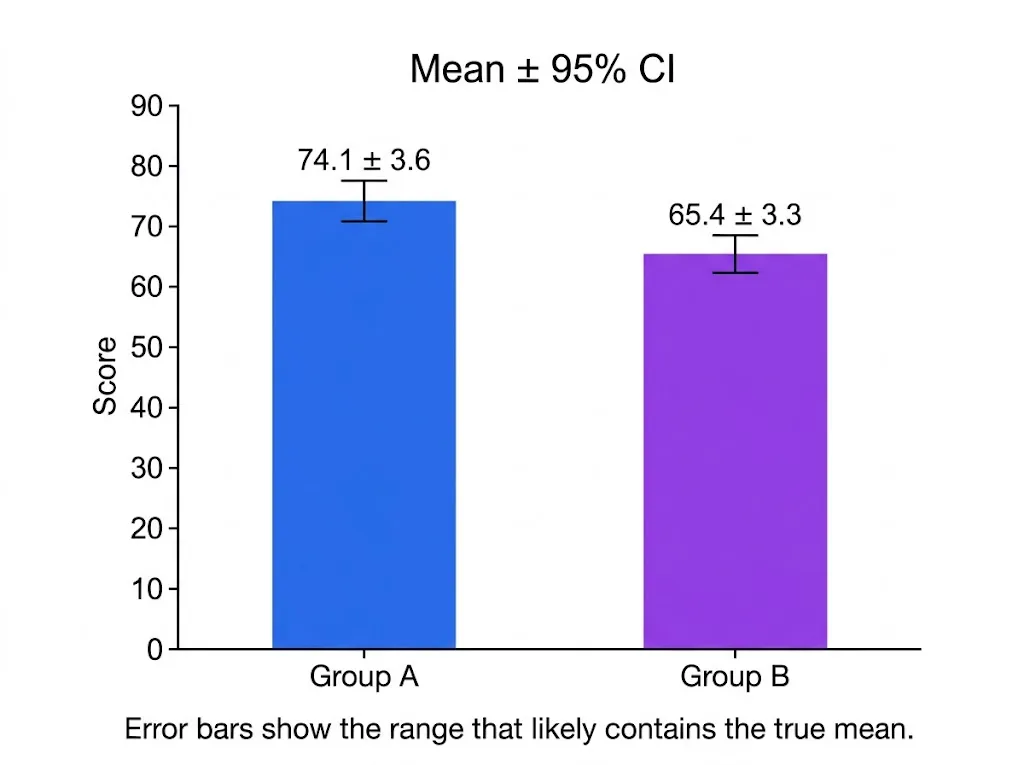
mean ± 95% CI: confidence interval

95% CI: helps to find where the true mean is

It determines the range that probably contains the true mean. This range can be as long as the SD bar if there are few replicates.

  • Use this type of graph when you want readers to examine differences between means.

Bar chart of the same two groups with mean ± 95% CI error bars, the range likely to hold the true mean

How Multilo takes you from idea to finished paper

Import Dataset

  • Attach your CSV or Excel file, or directly paste the raw replicate values.

Choose Error Metrics

  • Select Standard Deviation (SD), Standard Error of the Mean (SEM), or 95% Confidence Interval (CI) according to your choice.

Allow Multilo to Process

  • Statistical spread is automatically calculated, and a perfect publication-grade bar chart is ready.

Insert It Into Your Paper

  • Get your formatted figure directly fit into your research draft.
save time

Skip the Manual Work Behind Every Error Bar

Skip the Manual Bar Formatting

In Excel, you have to calculate the SD and SEM in separate cells, and then have to manually set custom error bars on those ranges. In Multilo, you select your desired error metric like SD or SEM, and error bars are prepared.

Skip the Expensive Software or License

You don’t need any separate statistical software package or expensive license for one bar chart or figure.

Skip the Coding

R language may give you control through packages and code syntax, but Multilo directly gives you a complete chart without any coding.

Skip the Guesswork

A common chatbot tells you about error bars, while Multilo makes plots by calculating the correct statistical values from your actual replicates.

Bar graph of mean plant height for Control, Fertilizer A and Fertilizer B, with error bars and each plant shown as a dot
Same eight plant heights plotted three ways, comparing SD, SEM and 95% CI error bar widths
One-click refine

Rework any paragraph without breaking your citations

Highlight a sentence and let Multilo paraphrase, expand, or summarize it — your sources stay linked and your references stay in sync.

ParaphraseExpandSummarizeChange tone

Built For Your Every Lab Experiment

Pharmacology dose responses

Compare the treatment groups at different doses, and make accurate error bars based on replicates of every group.

Molecular biology assays

Show your assay readouts on cell lines, different conditions, or time points.

Animal and human behavior studies

Summarize the overall performance and behavior of all groups in one chart during trials and across different cohorts.

Formulation and batch comparisons

Compare the new and old results of different formulations or product batches side by side.

Thesis and dissertation chapters

Keep the style, font, and design of all bar charts the same and professional in your whole thesis or research report.

Not Only One Chart: Your Whole Research Paper in One Workspace

Multilo is the first local AI research workspace. Draft your research document, cite references, and verify facts, all in that one project where your figures and graphs are generated.

Build a graph of all remaining Results

This workflow prepares the line charts, scatter plots, box plots, and heatmaps from Excel or CSV data. In this way, every figure in your thesis or research paper is built from the same place.

Make Texts Better Without Breaking Citations

Paraphrase any sentence by highlighting it, giving detail, and summarizing it. Your sources and references are safe and synchronized; they never break.

Frequently asked questions

Everything you need to know about writing with Multilo

Does Multilo directly make the error bars graph from raw replicate data?

Yes, Multilo automatically calculates the mean and error from replicate columns. You don’t need to calculate the summary statistics or calculations before.

What should I choose—SD, SEM, or 95% CI?

SD tells you how much your replicate data is spread. SEM, or 95% CI shows that how much your calculated mean is correct, while 95% CI give us that range in which the chances of actual mean. But you must choose according to your research questions and depict it in the caption.

How should I make a bar chart with standard error or standard deviation?

You choose your error metric (SD, SEM) in Multilo, and the error bars are instantly updated. (SEM is actually calculated by dividing the standard deviation by the square root of the number of replicates).

How does Multilo handle missing replicates in any group?

Multilo calculates every group with its recent replicates; therefore, the replicate numbers might be different in groups. Report the sample size n of every group in your figure caption or methodology.

How to understand the Overlapping Error bars?

Error bars show data variability or precision; they do not automatically calculate statistical significance. If error bars are not overlapping then it indicates the actual difference. And if they are overlapping, then the difference might be due to chance. Do not make a final decision by looking at the overlap; verify it with statistical analysis like a t-test or Anova.

What mistakes mostly occur in error bars?

Usually, people make mistakes like not writing the name of the error metric (SD, SEM, OR 95% CI), hiding the replicate numbers (n), choosing SEM because the lines are small and look good, and hiding the individual data points. But always write the metric name and n value in your caption.

Can I make edits after the graph is made?

Yes, when you build a figure with Multilo, you can make edits like colors, labels, error bar caps, and axis according to your choice.

Your Next Bar Graph Is a Click Away

Download Multilo, write a paper, and turn your replicate data from a spreadsheet into an error bar figure instantly